Preferences
Privacy is important to us, so you have the ability to disable certain types of storage that may not be necessary for basic website operation. Blocking categories may affect your experience on the Web site. Learn more.


Privacy is important to us, so you have the ability to disable certain types of storage that may not be necessary for basic website operation. Blocking categories may affect your experience on the Web site. Learn more.
Ishikawa diagram
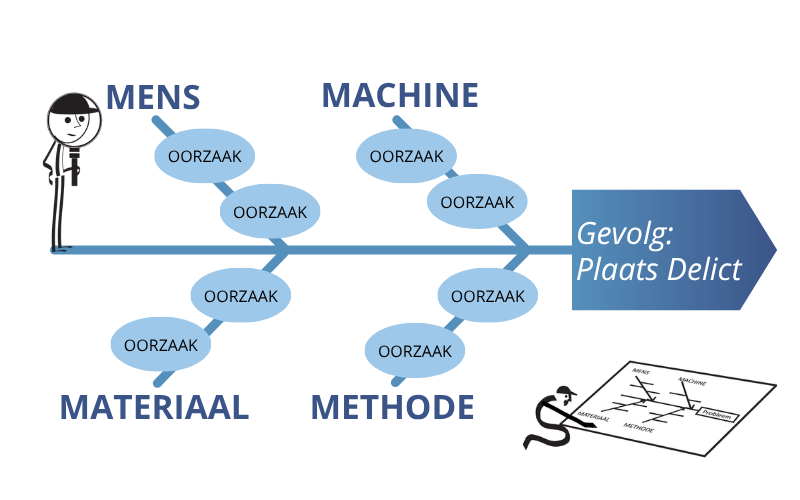
A visual tool for root cause analysis that organizes potential causes of a problem or deviation into structured categories. Because of the diagram’s shape, it is also known as a fishbone diagram or cause-and-effect diagram: the problem is at the “head” of the fish, and the causes form the “bones.” The central horizontal axis runs toward the problem, and the lateral branches represent the cause categories.
The diagram was developed in the 1960s by Japanese quality expert Kaoru Ishikawa, who first applied it at Kawasaki. Ishikawa’s key insight was that quality problems rarely have a single cause, but arise from an interplay of factors that only becomes apparent when you investigate systematically.
Structure and Categories
Thebranches of the diagram are organized around fixed categories. In Lean , the 4Ms Lean typically used as the main categories: Material, Machine, Man, and Method. Within each category, potential causes are further broken down into subcategories until the team has identified the actual root cause.
Practical Application
AnIshikawa diagram is best created as a team effort, involving people who are familiar with the process. The starting point is a clearly defined problem or effect at the "head" of the diagram. The team then systematically brainstorms possible causes by category—not to find a solution right away, but to first map out the entire landscape of causes.
The diagram is often combined with the "5 Whys" method: for the most likely causes identified in the diagram, further questions are asked until the actual root cause is found. Together, they form a powerful tool for structured problem-solving and the first step before formulating countermeasures in an A3 or Kaizen action plan.
The Importance of Lean
TheIshikawa diagram aligns with the Lean that problems should be solved at their source, rather than treated symptomatically. By forcing teams to take a broad view of materials, machines, people, and methods, it prevents them from jumping too quickly to an obvious solution without understanding the root cause.