Sparring about your Lean issue?
Call René

The theory of hoshin kanri is clear, but how do you apply it in a government organization structured in departments where making A3s is not an everyday practice? Rijkswaterstaat shares his experience.
In many ways, our journey to implementing strategy at Rijkswaterstaat 's Major Projects and Maintenance Department felt like walking in dense fog. We kept taking small steps, and just when we thought we were beginning to see light in the distance, the fog again swept over us.
We were led (and driven) by the belief that hoshin kanri (the Japanese term for strategy deployment) would help us focus on what really matters, but we weren't quite sure how to get there. It took two years of hard work to get a glimpse of our path to improvement and the challenges we face. Our path is now paved with clearly defined goals and monthly measurements that help us steer the ship.
At the department, all involved can be extremely proud of what we have achieved so far by taking small steps, reflecting on each one and continuously improving ourselves. We hope this article will help other government organizations find their own path to improvement.
Rijkswaterstaat is responsible for the design, construction, management and maintenance of Dutch infrastructure. Rijkswaterstaat employs some 8,800 people and has an annual budget of 5million euros.
As a result of the economic crisis and the resulting staff reductions, our department was struggling to maintain quality levels, schedules and costs on our projects. There was a lot of overtime, a general lack of focus and everyone seemed busy putting out fires. There seemed to be no time to look for solutions that would lead to better end results.
We wanted to find a way to focus our efforts on what really mattered and began to wonder if hoshin kanri could help. We came across the Lean Management Institute's hoshin kanri model and decided to apply it to our organization.

The key element of this model is that different levels of management in the organization plan together to solve the company's problems: at the strategic level, directors work with managers; at the departmental (or value stream ) level, managers work with team or group leaders; at the process level, team and group leaders work with front-line workers.
The role of the leader is always the same - to create a common understanding of the problems, ask for countermeasures, and guide people to possible solutions.
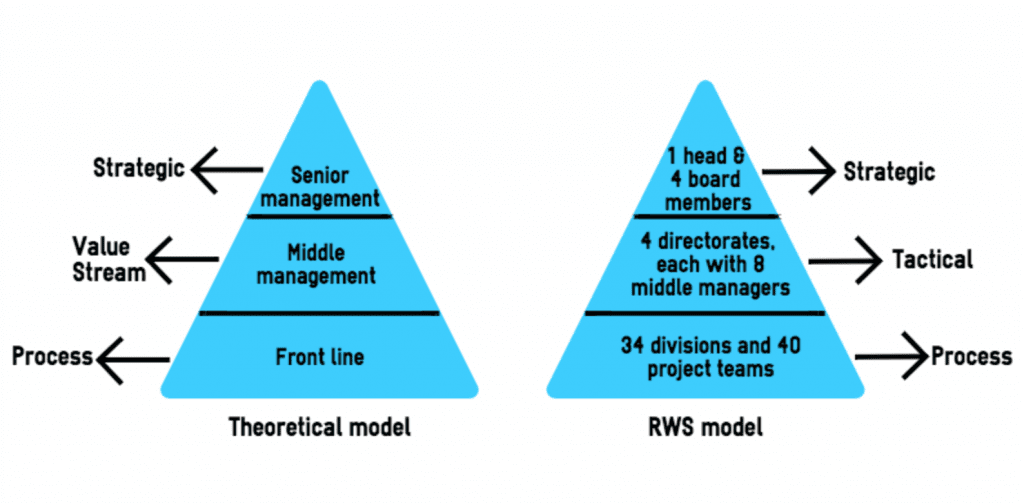
As we studied this theoretical model, we wondered if and how it might fit our processes and structure. Then we started visualizing it and discussing it with those around us. After a while, we came to the conclusion that it just seemed too far removed from our current state. Our organization was not yet ready to embrace a value stream structure, but we still wanted to try to leverage the benefits of hoshin kanri. As a starting point, therefore, we decided to use our traditional organizational model (a departmental structure) for the middle level - called the Value Stream Level in the Lean Management Institute's model.
At the strategic and operational levels, the structure of Rijkswaterstaat allowed us to follow the Lean Management Institute model. The chart below shows the difference between the theoretical model developed by the Lean Management Institute and the modified version we adopted at Rijkswaterstaat .
To continue our research on how to make it work, we built a communication model (see image below). We used it to spread the theory, test our ideas and at the same time build support among many people in the organization to begin rolling out the strategy. After a while, we (the lean team) were ready to take the next step, knowing that only by doing could we complete our understanding of hoshin kanri. As John Shook said:
"It is easier to act on a new way of thinking than to think on a new way of acting."
But first we had to overcome one big hurdle: convincing our board members to embark on this journey. Usually resistance arises because people don't really understand a concept and can't see the consequences for themselves. So we made an extra effort to convey the model to the board members in a way that matched their experience and appealed to them: we worked with examples from their own daily routines and explained how they would change if the model were applied.
We managed to inspire them, and they gave the green light to deploy the strategy!

The first step in the model is to identify goals. So we began by sifting through our documentation of vision, mission statements, management contracts, etc. in an attempt to find goals that would fit the four "macro areas" the theoretical model covers: Safety, Quality, Delivery, and Cost. We asked the board to prioritize each of the goals appropriately and select a set for the coming year.
To give an idea, the Primary Objectives of Rijkswaterstaat are to be accountable to our minister, colleagues and contractors, and to ensure a reliable infrastructure network.
For the Major Projects and Maintenance Department, these are translated into the following key objectives:
At this point we had to determine what actual performance (in terms of numbers) we wanted to get for these goals and what numbers we wanted to put on the visual boards. We looked for people in the organization who could provide us with the right data, and asked their opinions on what the biggest obstacles would be in achieving these goals. This provided a wealth of information and helped us realize how much data the Board never actually achieved.
Over the next two months, we collected and presented all the facts, figures and problems to the council members. They got into the habit of beginning each meeting by reviewing the visual information, and the subsequent discussions began to give them much insight into current performance and the biggest problems facing the department.
It was the first time the Board experienced the benefits of visualized information organized around the four macro areas of the model (Safety, Quality, Delivery and Cost - or SQDC). With the insight gained, they could now select the goals and charts they wanted to track on the visual board. After four weeks, the first version of the strategic visual board was ready and board members began tracking and discussing monthly progress. Now they could track departmental performance on a monthly basis and respond immediately to deviations, rather than looking back at what had already gone wrong.
This was the idea...

And this is how we put it into practice

The theoretical model shows that the power of hoshin kanri lies in the dialogue that takes place between different levels of management. So we (the Lean team) challenged our executives to begin using catchball communication. This method is used to create consensus and alignment on goals and plans between levels of management through dialogue.

Board members began the catchball process by taking middle managers to the visual board and asking them for feedback on the chosen goals and objectives. After several iterations, consensus was reached and a final decision was made on the goals for the coming year.
Middle managers reported being very satisfied with the dialogue and happy to be involved in goal setting. At the same time, they discovered new ways to work together as a team.
The next step was to translate the strategic goals set by the board (with input from middle managers) into tactical actions to be implemented further down the organization. Middle managers discussed their contribution to the strategic goals with the board. This began by examining the primary purpose and mission of each management team. From there, it was possible to formulate each team's specific contribution to the organizational goals and determine the problems they could solve from their position.

After six months, we created an obeya with one strategic board and four tactical boards (one for each management team). Meanwhile, we also improved the look and feel of the boards. Our board members convinced us (the Lean team) that the experimentation phase was now over - we took that as a hint that the boards needed to look good.
The obeya (meaning "large meeting room") is a room or space where all those involved in a process come together and where all relevant information (goals, plans, deviations/problems) is displayed in a visual form on the wall. It helped us tremendously.
Executives and management teams began routinely checking and discussing facts and progress standing in front of the visual board. This occurred three times a month. Their main focus was on the left side of the board, where the graphs with data on current performance are located.
They were still managing in a traditional way: when the numbers told them that goals were not being met, their first reaction was to fix the problems by going into firefighting mode. Needless to say, this was no way to achieve structural improvement.
Fortunately, we had a plan to change this.
At this point, the visual board was full of goals, current accomplishments and our biggest problems. There were no strategic A3s and no analysis of the root causes of our problems. Because everyone saw creating an A3 as a huge and very difficult undertaking, we could not convince people to get serious about this method. However, it began to become clear that the many improvement projects we had running were not solving our problems.
We accepted the lack of A3s and decided to visualize all the improvement projects we had running in the organization and tried to place them under the four macro areas of Safety, Quality, Delivery and Cost. This showed that we had more than 140 ongoing improvement projects. The Board of Directors couldn't believe it, and again stressed the importance of focusing more on truly critical items.
What followed was a sorting exercise, where we tried to determine which projects contributed to achieving our goals and which did not. We ended up with 80 projects. The next big question we had was at what level to monitor the improvements: the Board of Directors decided to monitor the top five on their visual board, while the rest of the projects were assigned to the various boards of middle managers or divisions.
The board members realized that the sorting exercise was not enough to figure out which countermeasures were the most effective (they still had too many to look at). This was when they realized why the strategic A3 in the model was so important.
A collaborative experiment was launched, in which a board member and two middle managers worked together to fill in the left side of the A3. In the analysis phase, people from all four management teams came together to consider the problem at hand. In this way, a horizontal connection was made. As a result, it became clear that the management teams were all struggling with the same problems. As they worked together to formulate appropriate countermeasures, they also began to look for ways to work together to solve problems more effectively.
A few months later, four strategic A3s were hanging on the strategic board, thanks to the combined efforts of two levels of management. What a win! While previously our focus and agendas changed every week, visualizing and putting the implementation process in a logical order allowed us to stabilize our scope and zoom in on the vital few, step by step.

At meetings, board members experimented with their new role as Lean leaders. They practiced asking questions rather than solving problems for others, and began challenging their middle managers to seek countermeasures. At the same time, middle managers experienced what it means to work in an environment where daily accountability, transparency and short-cycle improvements are the norm. It was not always easy to integrate this new way of working into their routine, because their schedules normally required them to run around putting out fires all day. For a long time, it seemed like they were handling two different management styles at once.
During the implementation process, it became clear that without up-to-date data, monitoring would be impossible. Finding information that says something about our chosen objectives and the progress of our countermeasures often proved challenging, because in our environment measuring lead times, defects and other basic KPIs was not common.
We realized that striving for perfection would cost us momentum. So we decided to start by visualizing the first basic piece of information we could find. For the countermeasures, we made simple cards with the name of the countermeasure and asked people to put them in the red or green part of the obeya board, based on their gut feeling. All this was just to get the performance dialogue going. Gradually we found ways to improve the information on the obeya boards.
Our Operations Department took responsibility for improving and generating the data and provided monthly updates. Their role is essential because without data, board meetings would be completely meaningless.
After a while their role began to change: whereas before they struggled to get the right data on performance and produced many reports whose headlines were the only thing people really read. Now the department had become an active part of the dialogue in front of the visual board, and board members consulted with them to get background information. In return, they were more in touch with the board's needs and were able to provide better management information.
The final step in implementing hoshin kanri at all levels of management is extending the system to operations.
To do this, middle managers began talking to their people about the specific contribution to organizational goals. Gradually, however, we discovered that we had to define, standardize and stabilize each division's processes before we could determine an actual contribution.
As we began to do this, managers began to understand the importance of their engagement with their people. It is critical to observe what they do, the processes they follow and the problems they face. We are still working on it.
Our hypothesis is that when the processes are explicit enough and each division can easily do its day-to-day work, managers will be able to decide what the divisional goals of safety, quality, delivery and cost should be, and how to actually solve the problems identified at the strategic and tactical levels.
We are far from there, but when we finally get there, the alignment is complete.

The model took us on a journey that helped us focus on our main goals and create a dialogue throughout the organization (both vertically and horizontally). It helped us see our real problems and develop synergy and collaboration. Gradually we learned to look for real facts and solve our problems using A3 thinking, and our managers developed their Lean skills. Looking back, we realize how much the model taught us about Lean. If you feel inspired and are thinking about starting a similar journey in your organization, here are a few things you should be aware of (which made it work for us):
We created a communication model so people could really understand the concepts we were explaining and see the implications for themselves. It can also be used to simulate how it might work in your organization.
If the theoretical model does not immediately fit your organization, find a way to develop the model into exactly what you need, step by step. We decided to use our traditional organizational model(departmental structure) as a first step. Every situation is different, and your approach should reflect that.
The strategic A3 is essential because it provides the connection between goals and countermeasures. We decided to ignore the A3 the first year because we couldn't get people to work with it, but after a while we realized it was the missing element of the equation.
The business department plays a vital role because without up-to-date information, board meetings are meaningless.
"Developing Lean leadership and daily accountability is not about implementing a model or changing an organization, but about changing behavior."
Occasionally we stepped into the shoes of our management team to really understand what they were going through and realized how difficult it was to bring about this change. This insight gave us the patience we needed.

Sign up for our newsletter


